Explain the methods, show your working and interpret results in context.
Foundation shows shared notes and questions. Higher includes the labelled extensions. Maps and checklist downloads include labelled Higher content; the worksheet generator filters individual goals.
Revise the key ideas
Relationships and prediction
Paired plots — Plot each pair once with explanatory x and response y, axes, units and appropriate scales. A point (4, 30) records response 30 for explanatory value 4, not two unrelated observations. Plot the raw pairs before summarising the relationship.
Direction and strength — Positive correlation means y tends to increase as x increases; negative means it tends to decrease. Stronger correlation has points closer to the trend, not necessarily a steeper slope. Zero correlation describes no identified association of the specified kind, not identical values.A fitted trend with scatter. Original illustrative diagram; numerical datasets are fictional worked examples.Enlarge diagram
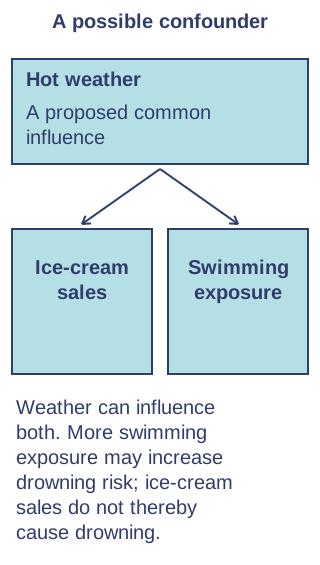
Causation and confounding — An association does not establish that changing x causes y. A third variable may affect both, the direction may be reversed, or the association may be accidental. Compare study design and plausible mechanisms; multiple interacting influences can explain a pattern.
Double mean point — Calculate the mean of all x values and separately of all y values. A by-eye line of best fit passes through (x̄, ȳ) and follows the overall linear trend with balanced scatter. It need not pass through every point or through the origin.
Interpolation — Estimate y for an x within the observed range by reading the fitted line. This is interpolation, not an exact result for an individual. A weak trend gives a less dependable estimate; retain units and acknowledge the scatter.
Extrapolation — Estimating beyond observed x values is extrapolation. The relationship may change outside the range, and a line can predict impossible negative counts. Check context and distance from the sample; a convincing fit inside the range does not guarantee distant predictions.
Gradient and intercept — Gradient is response change per one unit increase in x; intercept is fitted y at x=0. Their units differ. An intercept may have no practical meaning if x=0 lies outside the data or is impossible in context; do not force a causal interpretation of slope.
Given rank coefficient — Spearman's rank coefficient lies between −1 and +1. Values near +1 indicate strong agreement in ordering; near −1 indicate opposite ordering. A value near zero indicates little rank association, without proving independence or absence of every possible pattern.
Higher — coefficients and regression
Regression equation — Use a given y = a + bx to predict response for an explanatory value. If y=18+2.5x and x=4, predicted y=28. Interpret a and b in context and observe interpolation limits; this y-on-x model should not simply be reversed to predict x without justification.
Rank and differences — Rank both variables in the same direction, pair the ranks for each item and calculate d as their difference. Square every difference and sum d². Edexcel does not test tied ranks in the Spearman calculation; ordinary distinct ranks run from 1 to n in each column.
Spearman calculation — Use the given formula rₛ = 1 − 6Σd²/[n(n²−1)]. For n=5 and Σd²=4, rₛ=1−24/120=0.8. Check the result lies in [−1,1], explain its sign and avoid rigid invented boundaries for strong and weak.
PMCC — Given Pearson product moment correlation r measures linear association. A value −0.9 suggests strong negative linear correlation; r=0 means no linear correlation, but a curved relationship may still exist. PMCC calculation is not required in this course.
Compare coefficients — Spearman uses ranks and can reflect a monotonic curved trend; PMCC uses the original numerical values and measures closeness to a straight line. A perfect increasing curved relationship can have Spearman +1 while PMCC is below +1. Neither coefficient alone establishes causation.
Test yourself
30 questions · Sets of 10 from the selected tier. For fractions, use / when typing; for powers, use superscripts or ^. Follow each question's answer format. These quick checks support revision; practise full written solutions, graph constructions and enquiries too.
Mind map
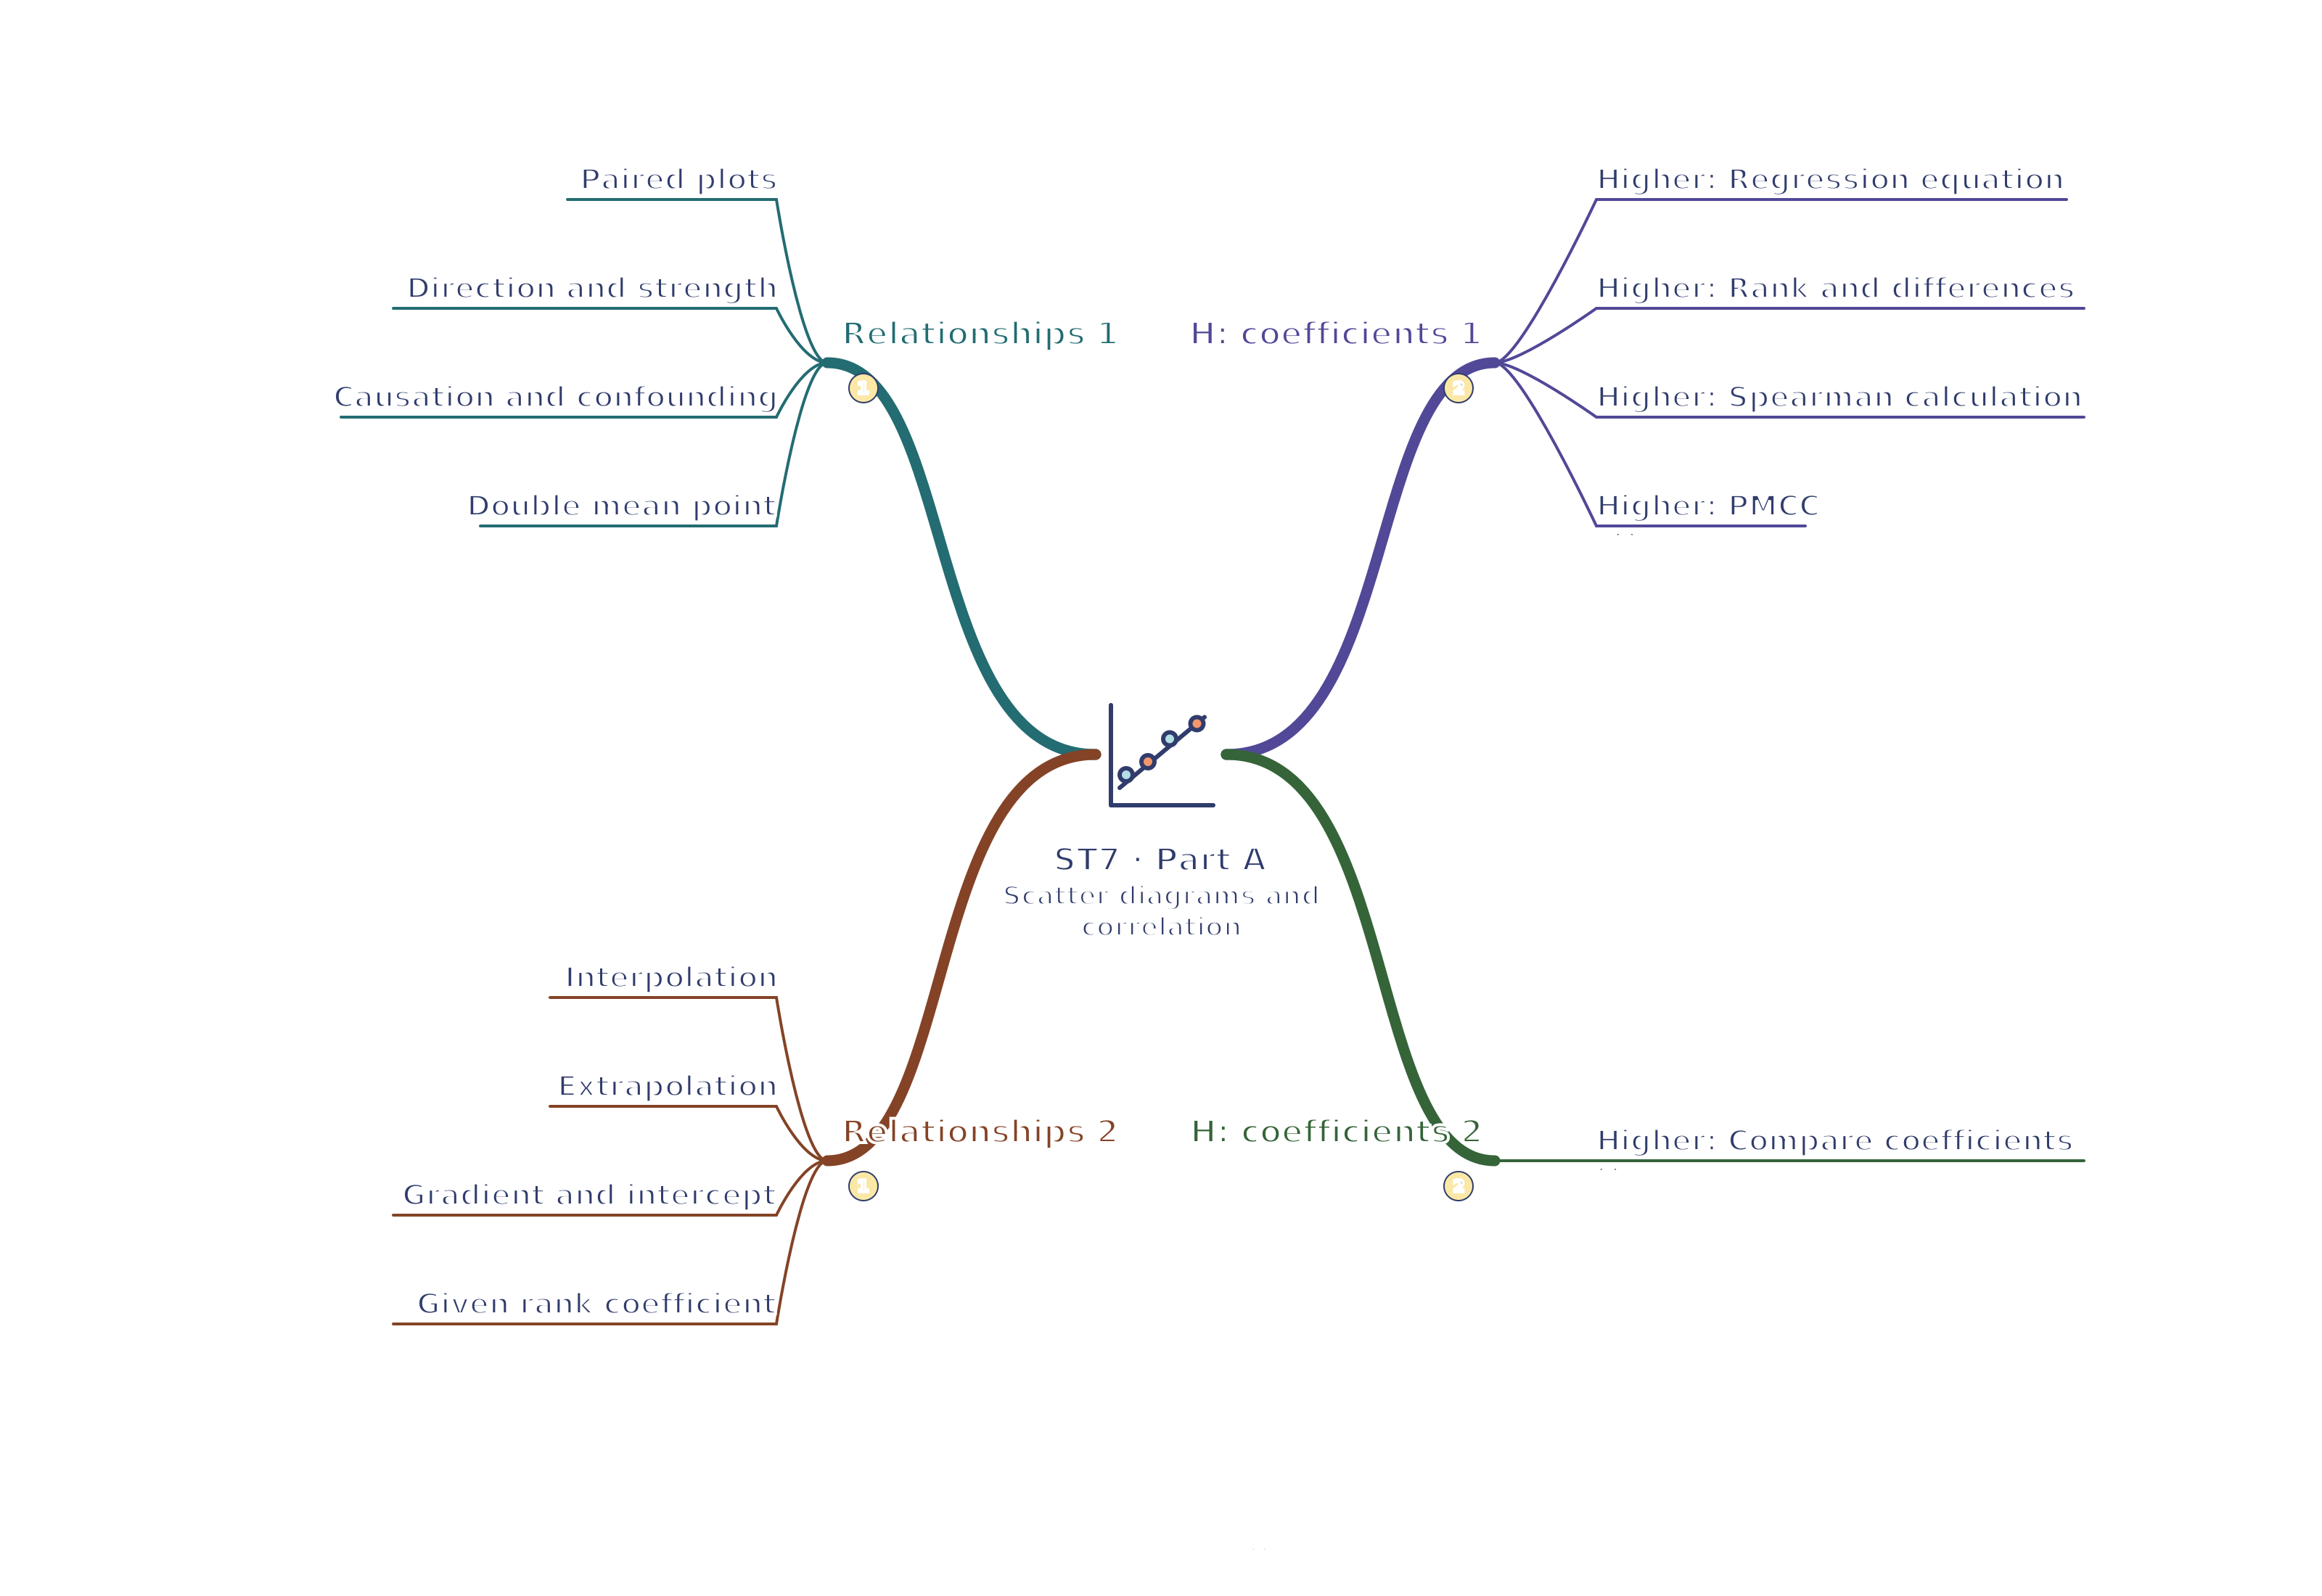
Use the branches to recall the ideas and explain their connections. Check the revision notes for the full detail.
View ST7 · Relationships 1 / Relationships 2 / H: coefficients 1 / H: coefficients 2 mind mapOpen the full-size map to zoom. Download the PDF to print on A4 or enlarge to A3.
 Mr Kidman's Classroom